1. Introduction / Background
We propose a multimodal ML pipeline to process de-identified urology visit artifacts (scanned reports and images) and train supervised models that generate reports similar in style and content to the originals. The task involves aligning textual reports with corresponding images so that, when given an unseen study, the system can output a coherent, clinically styled draft.
Multimodal medical models are advancing rapidly: Google’s MedGemma is designed for medical text-image comprehension and shows strong benchmark performance [1], [7]. LLaVA-Med [2] and BiomedCLIP [3] demonstrate effective biomedical vision-language alignment, providing open-source starting points.
Note: ClinicalBERT was originally considered as a potential text-only baseline in the proposal but was not implemented for this checkpoint, as the project scope shifted toward multimodal models (MedGemma and BioMedCLIP) for stronger image–text alignment.
Some scans contain text burned into images (faxed forms, typed overlays). To make these usable, we apply OCR preprocessing [5], [6].
Dataset
We’re starting with 99 studies, each structured as:
/scans/- PNG images (some with annotations)/ocr/- OCR outputs from Advanced Urology’s scriptreport.txt- Corresponding urology report
Note: While the original AU handoff contained 198 folders, only 99 studies were usable at this stage due to incomplete or corrupted scans. The remaining studies will be incorporated later once cleaned.
This gives us paired multimodal data: images (plus OCR text) aligned with reports. More studies will be added over time.
2. Problem Definition
Problem: Given urology studies (scans plus optional OCR), we aim to train supervised models that generate clinical reports similar to the references.
Motivation: Radiologists interpret scans and draft detailed reports that urologists rely on for patient care. This process is very time consuming at scale. An assistive system that generates a first pass draft could streamline workflow [8], [9]. Radiologists would only verify and edit, reducing reporting time, improving consistency, and giving urologists faster access to structured reports. This system is assistive only, it’s not a replacement for actual clinicians.
3. Methods
Preprocessing
For this checkpoint, we implemented a full image preprocessing pipeline to standardize the raw ultrasound scans before model input.
All scans were converted to a consistent RGB format, resized to 224×224 pixels, and normalized to a [0, 1] intensity range to ensure compatibility with pretrained vision–language encoders such as BioMedCLIP and MedGemma.
Studies containing corrupted or blank images (identified via extremely low pixel variance) were automatically filtered out.
Each processed study folder was saved to a new output directory with a corresponding summary.json file logging:
- number of valid images processed, and
- presence or absence of an accompanying report file.
These steps guarantee that every study used in downstream modeling has uniformly sized, high-quality image tensors suitable for embedding extraction and generation tasks.
No OCR or text normalization was applied for this checkpoint; those steps will be incorporated during multimodal fine-tuning in later phases.
Models Implemented
BiomedCLIP Embeddings (Unsupervised Preprocessing Component)
- Purpose:The purpose is to convert ultrasound images into numeric representations for potential multimodal training.
- Justification: BioMedCLIP provides domain-specific image–text alignment, making its embeddings valuable for future supervised fine-tuning or retrieval.Its embeddings capture imaging patterns, clinically relevant visual aspects, and anatomical structures so it is an excellent choice for preprocessing ultrasound data, which can have higher variability.
- Status: We implemented this successfully and extracted and saved the embeddings for the 99 ultrasound studies. These embeddings were not yet integrated into downstream models for the midterm, but they establish the foundation for the multimodal training we’ll do for the next steps in this project.
MedGemma Vision–Language Model (Supervised Model)
- Purpose: We want to evaluate out-of-the-box performance of a pretrained multimodal medical model on urology data. It would also need no additional supervision or fine-tuning. Our goal was to see whether MedGemma could generalize to the urology ultrasound data and be able to generate reports that have comparable meaning to the original ones.
- Justification: MedGemma is specifically trained for medical image captioning and text generation, making it more suitable than generic LLMs. Its architecture supports long-context multimodal comprehension—ideal for multi-scan studies. Unlike simple CNN-based approaches, MedGemma can maintain anatomical context and is able to generate natural-language clinical interpretations. It is also pretrained on clinical vocabulary so it uses wording that is similar to that of a real urology report written by a doctor.
- Implementation: Each study’s image set was passed through the MedGemma encoder–decoder via Hugging Face. The model then produced text reports and these outputs were saved under /medgemma_reports/. These outputs are the basis of our evaluation which we did using semantic and lexical similarity metrics.
Current Status
At this stage, the group completed the image preprocessing pipeline and generated baseline MedGemma outputs for all 99 studies.
Next steps involve aligning these generated reports with the real AU reports and evaluating similarity via BLEU, ROUGE, and TF-IDF metrics before proceeding with fine-tuning.
4. Results & Discussion
Evaluation Metrics
Our MedGemma model was evaluated using six quantitative metrics: BERT Cosine, TF-IDF, ROUGE-L F1, BLEU, METEOR, and Jaccard.
Each metric captures a different aspect of similarity between generated and reference reports — from deep semantic alignment (BERT cosine) to surface-level lexical overlap (BLEU, ROUGE-L, Jaccard).
The visualizations below summarize these distributions across all studies.
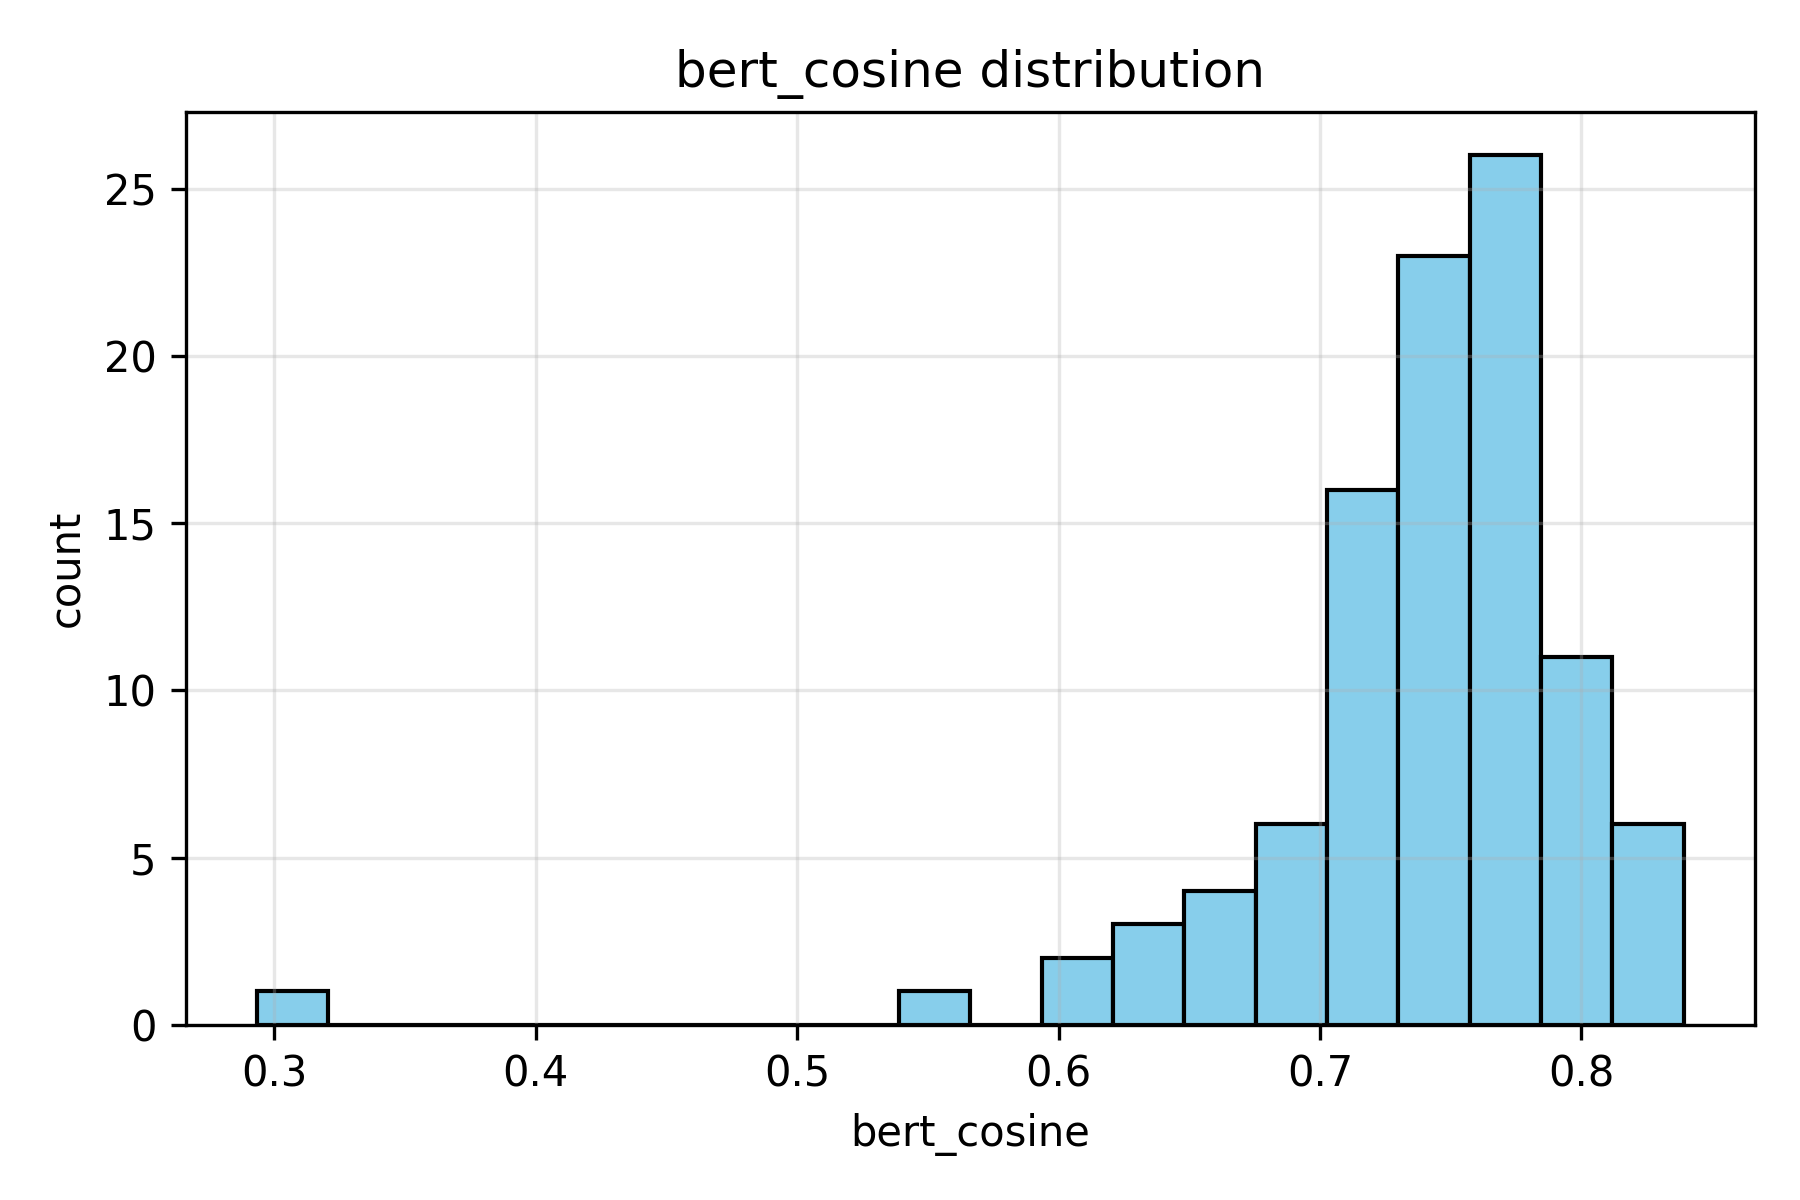
Figure 1. Distribution of BERT cosine similarity scores between MedGemma-generated and reference reports. Scores ranged from roughly 70% to 82%, with most studies clustered around high semantic similarity. Only a few outliers fell below 60%, suggesting isolated cases where meaning diverged from the reference.
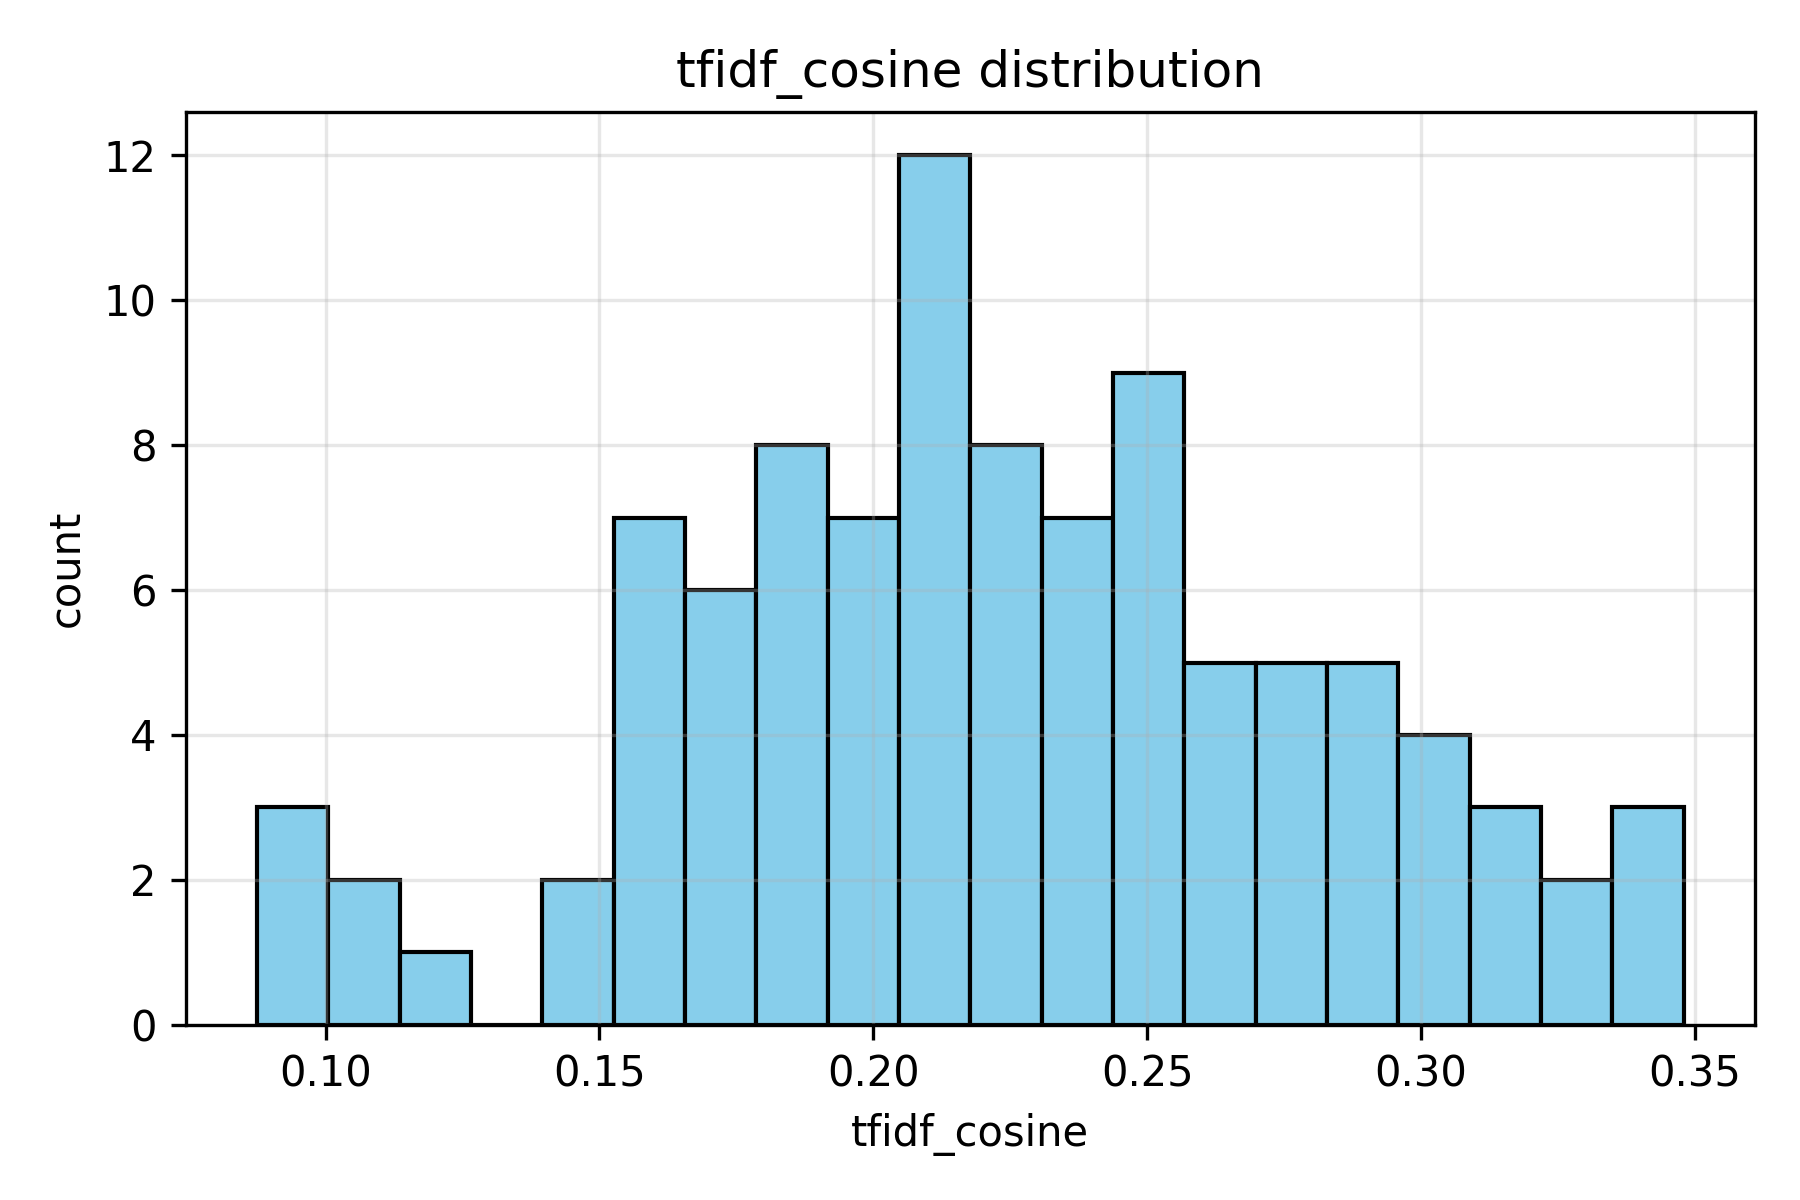
Figure 2. TF-IDF cosine similarity distribution. Scores between 18% and 28% indicate moderate lexical overlap, showing that MedGemma’s reports reused limited surface phrasing from the originals.
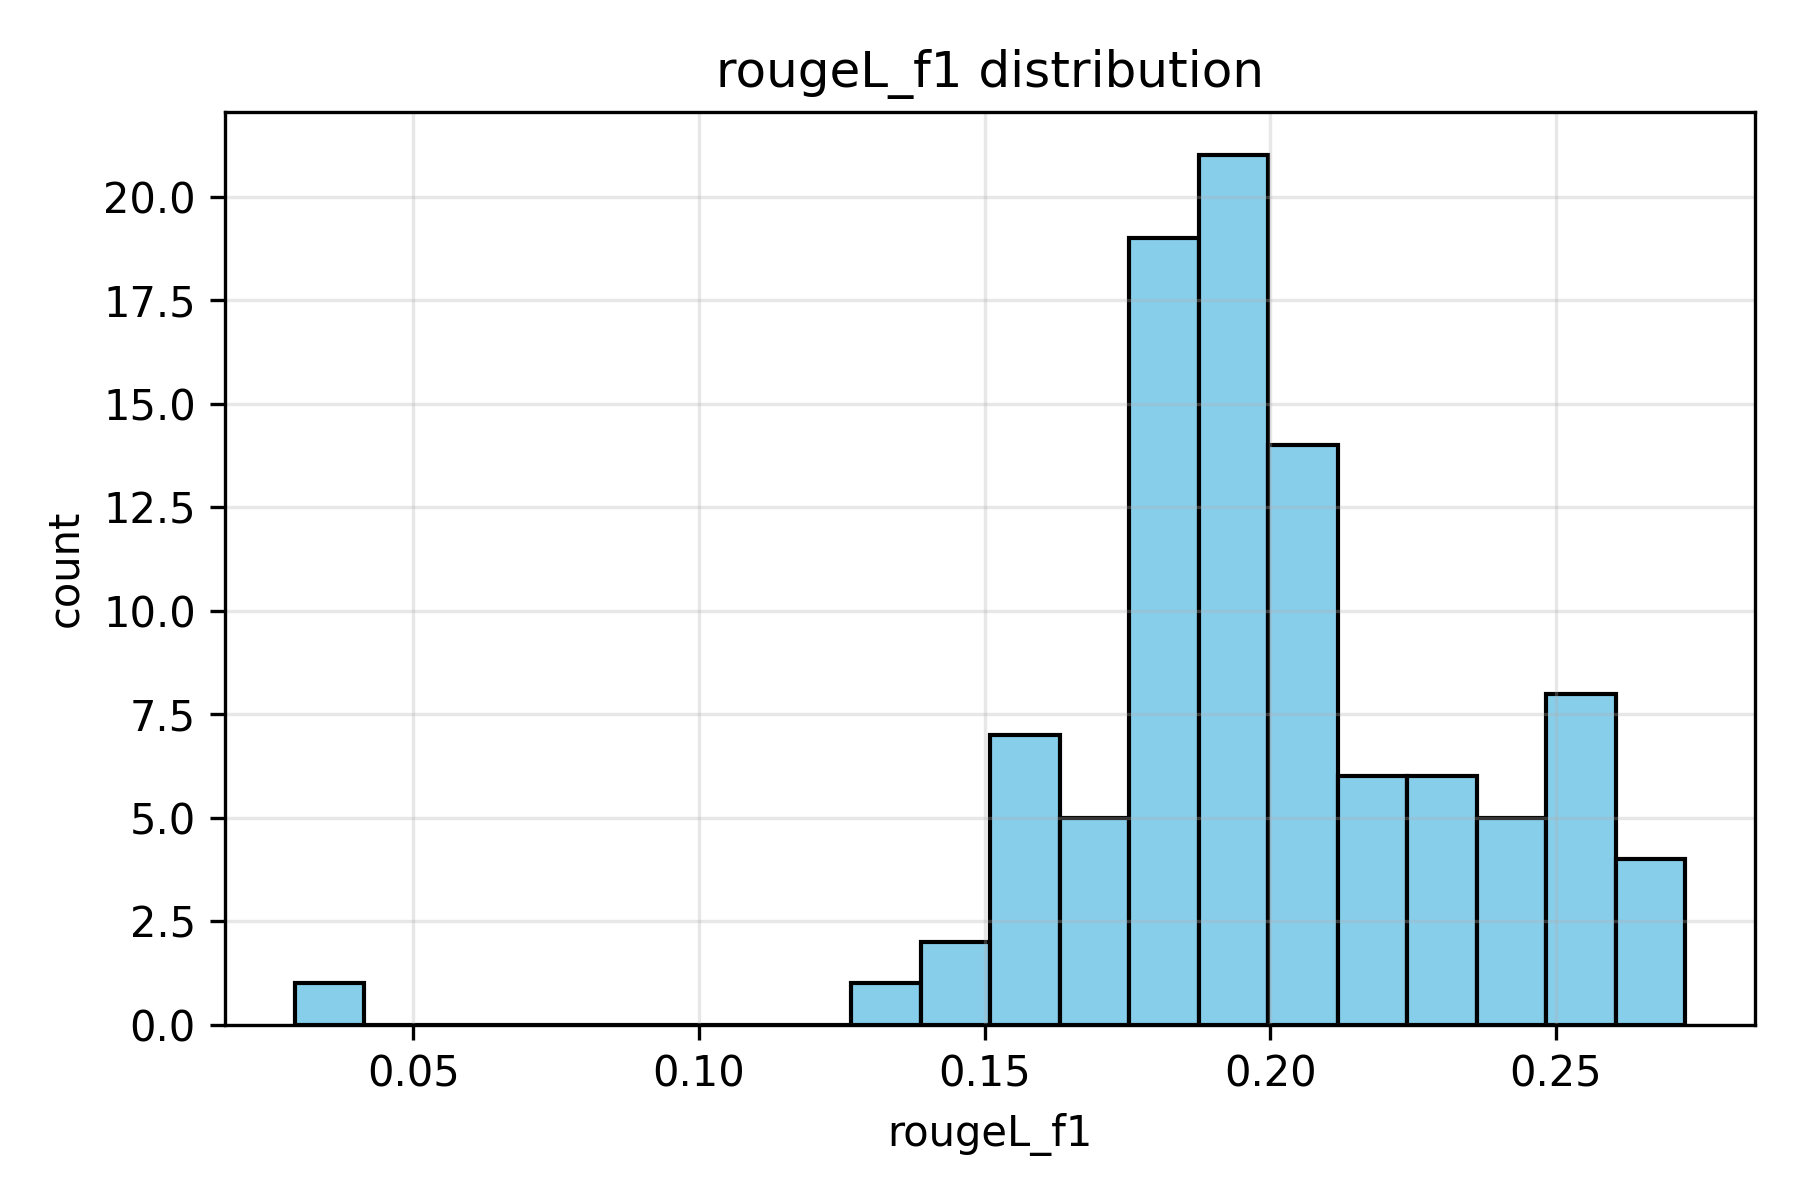
Figure 3. ROUGE-L F1 score distribution. Values centered around 18–22% reflect low literal recall but still consistent structural alignment, implying that generated reports follow similar phrasing patterns without exact wording.
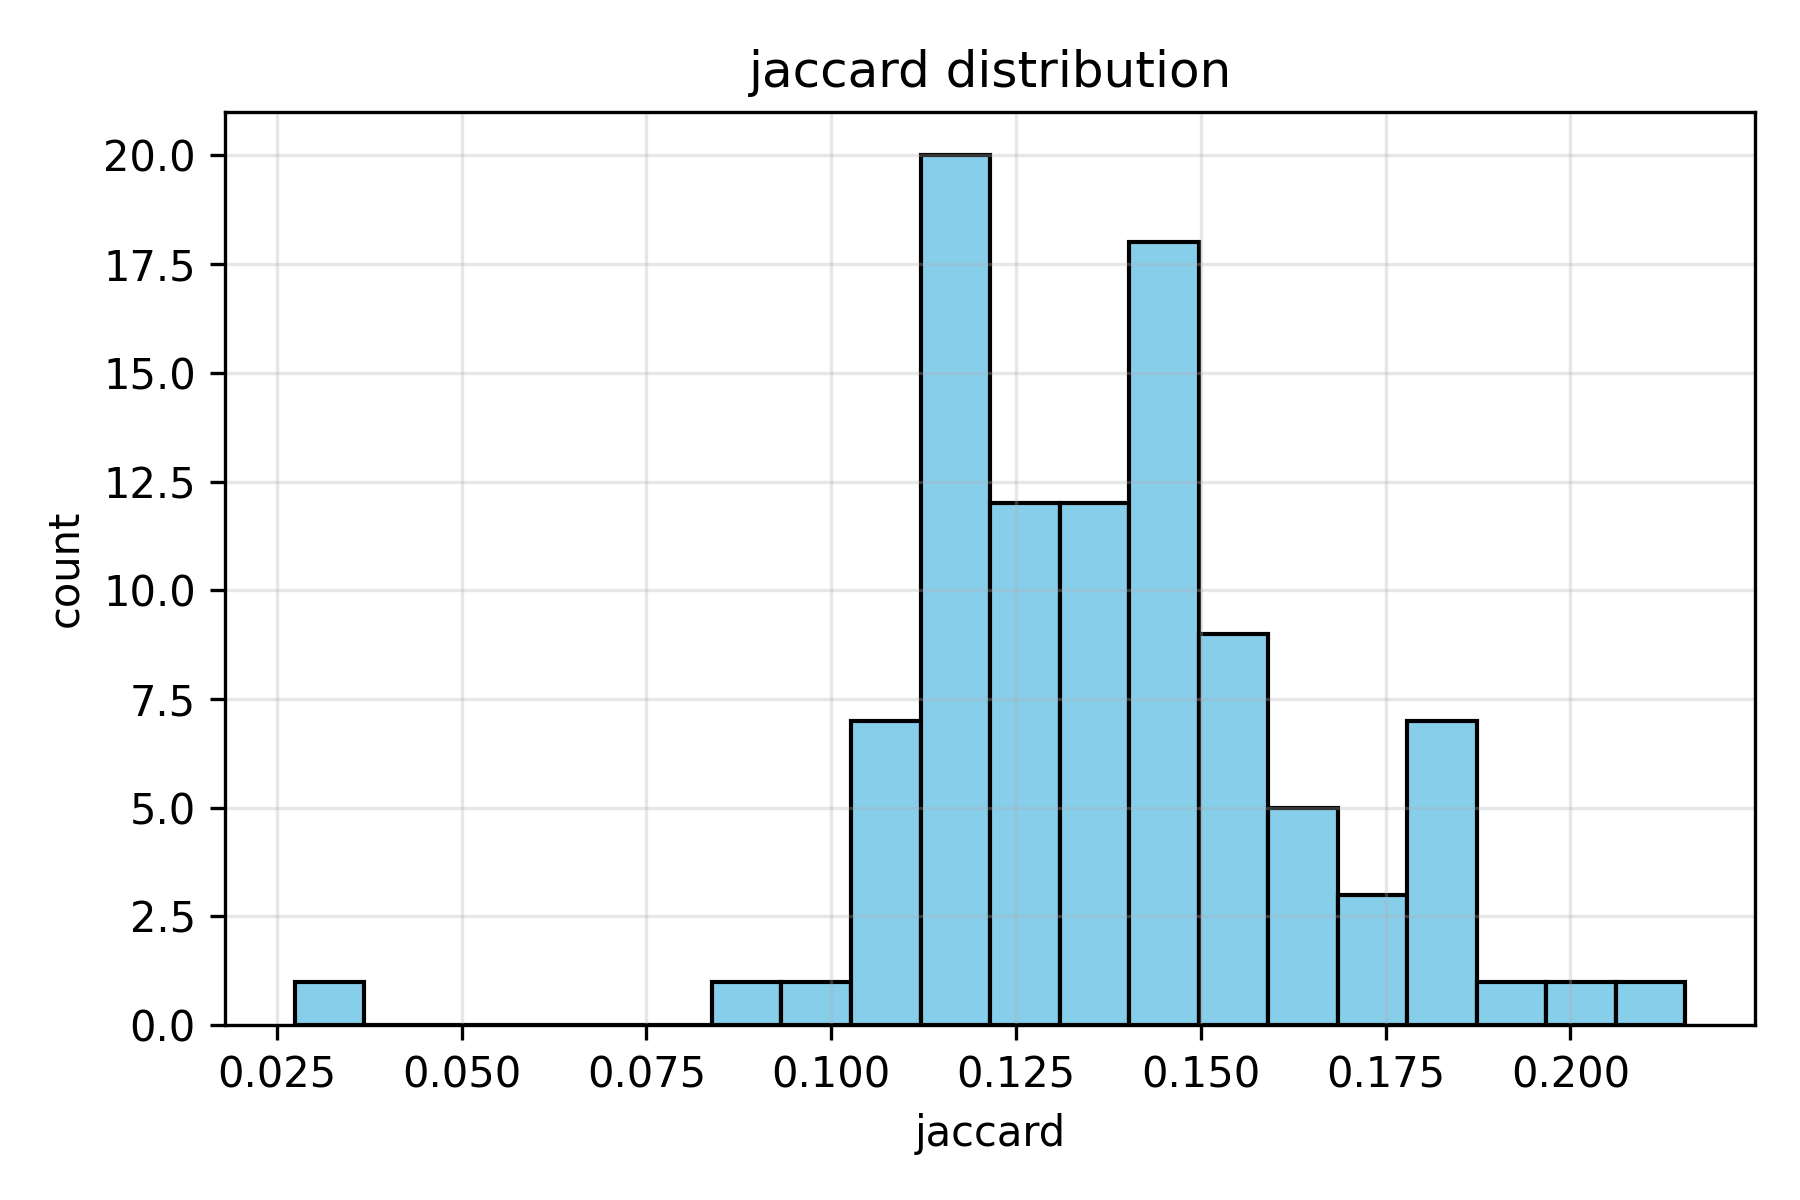
Figure 4. Jaccard similarity distribution. Scores between 11% and 16% show that while shared vocabulary exists, the model frequently rephrases or substitutes synonyms instead of reusing identical terms.
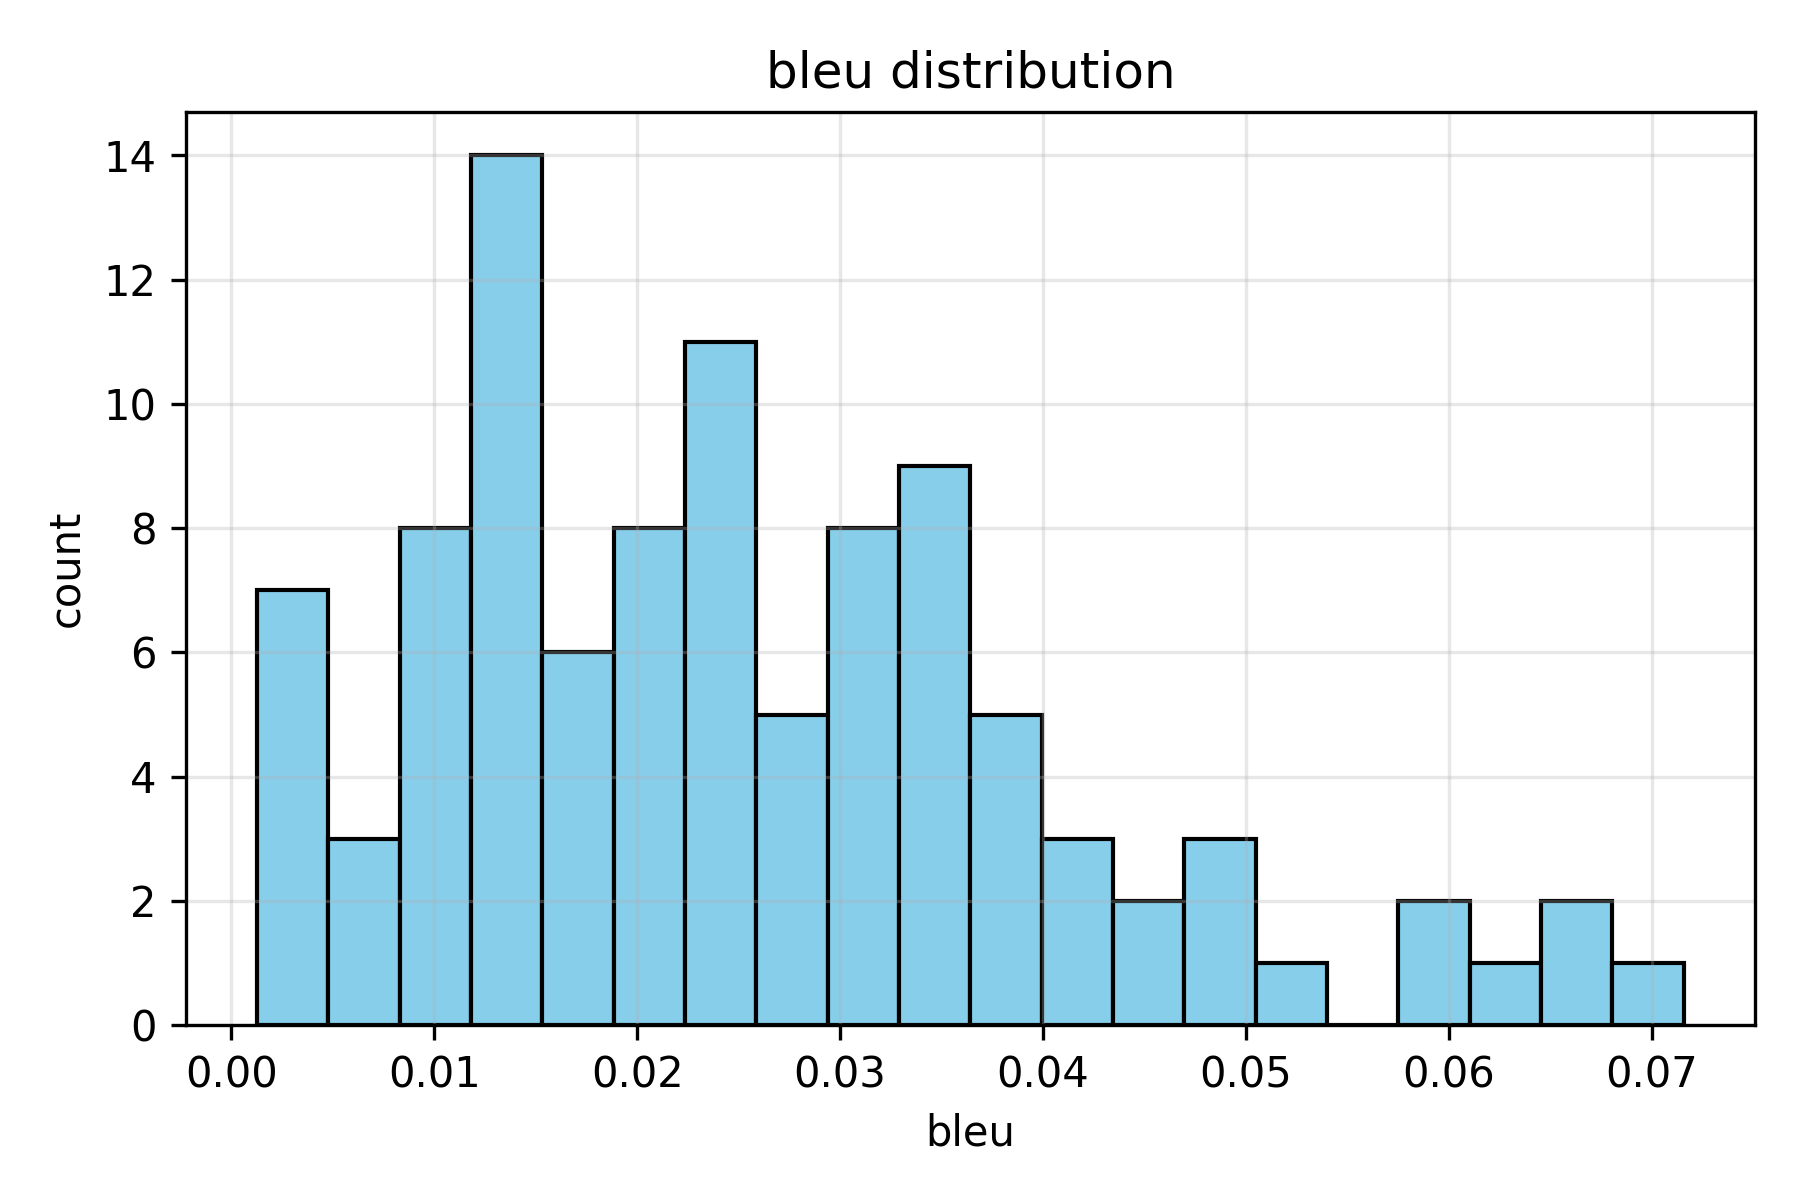
Figure 5. BLEU score distribution. BLEU values were extremely low (1–5%), consistent with the model’s tendency to paraphrase rather than copy sentences, as BLEU penalizes even minor word-order differences.
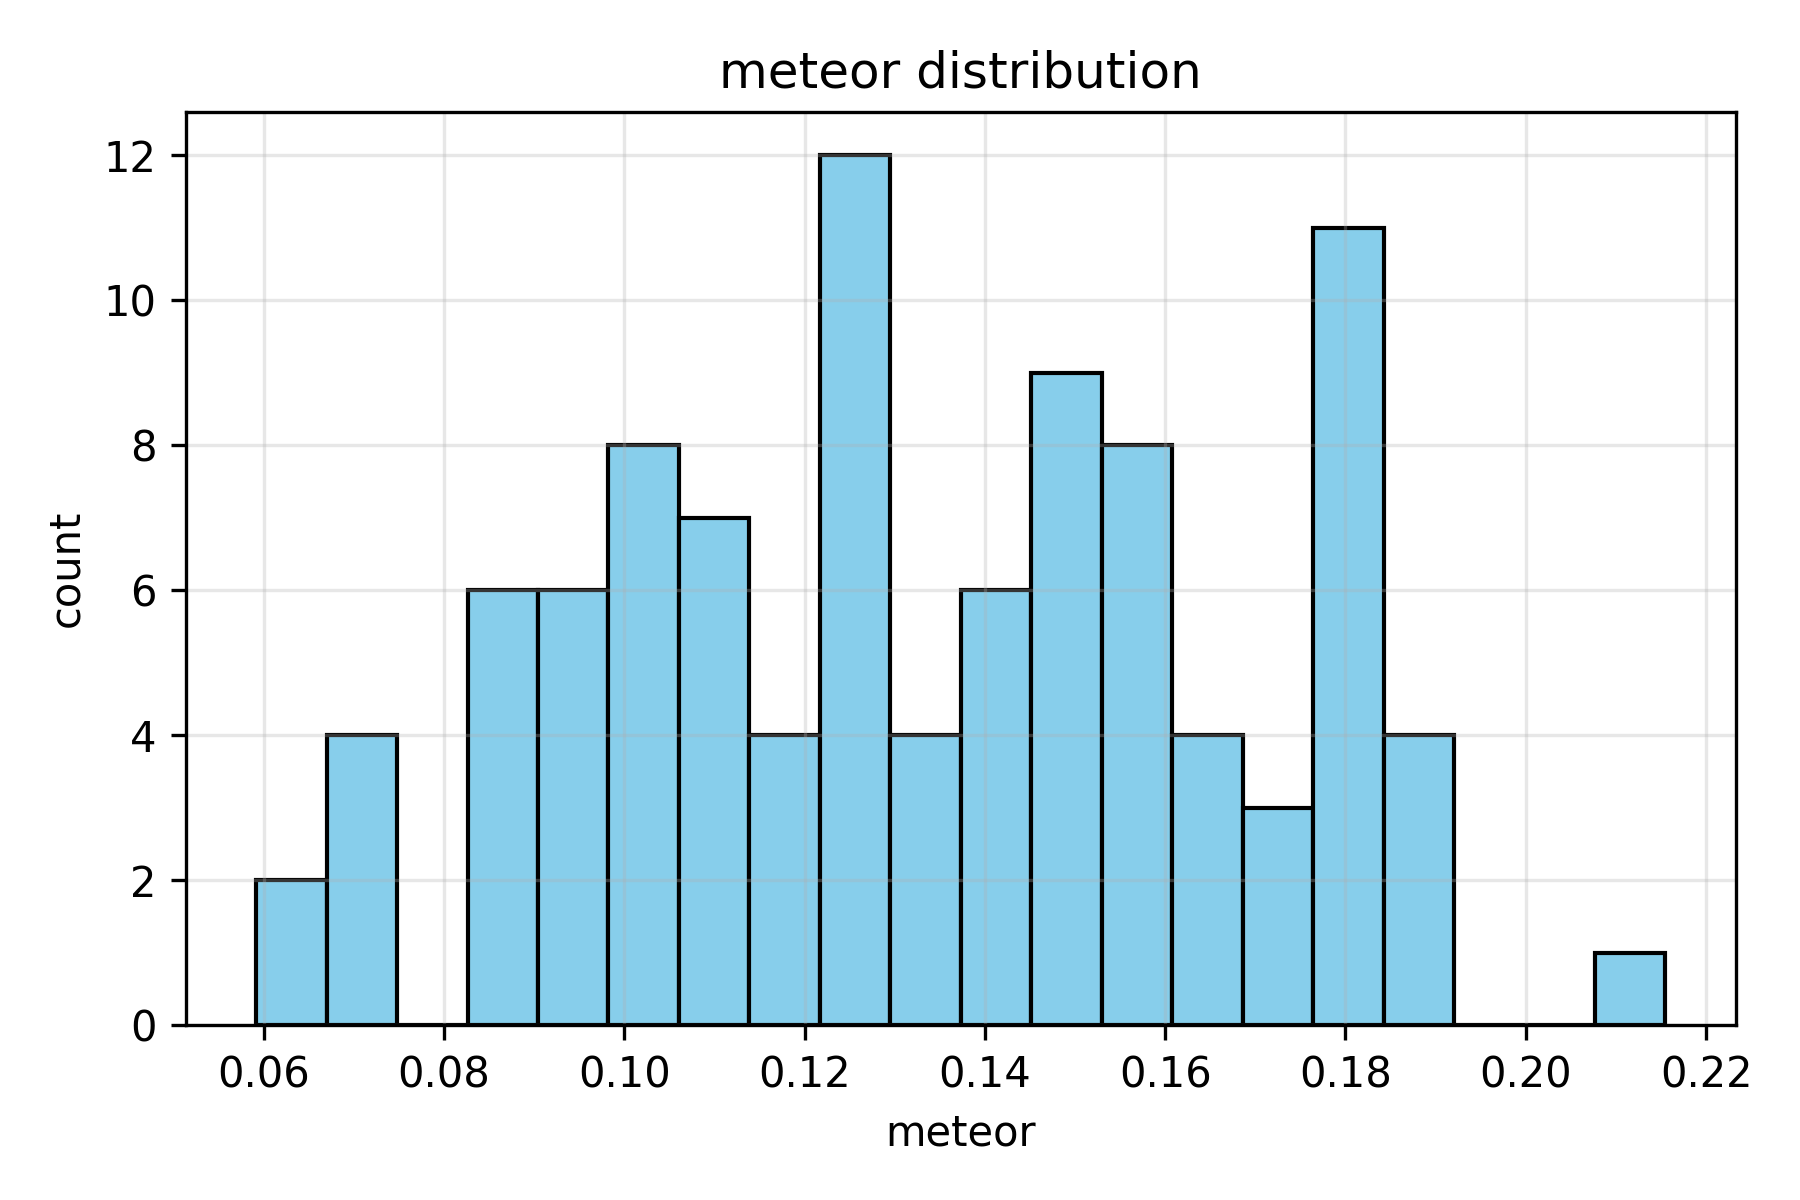
Figure 6. METEOR score distribution. Scores ranging from 10–18% demonstrate partial alignment; METEOR’s inclusion of stemming and synonym matching captures some overlap missed by stricter metrics like BLEU.
Metric Trends and Visual Analysis
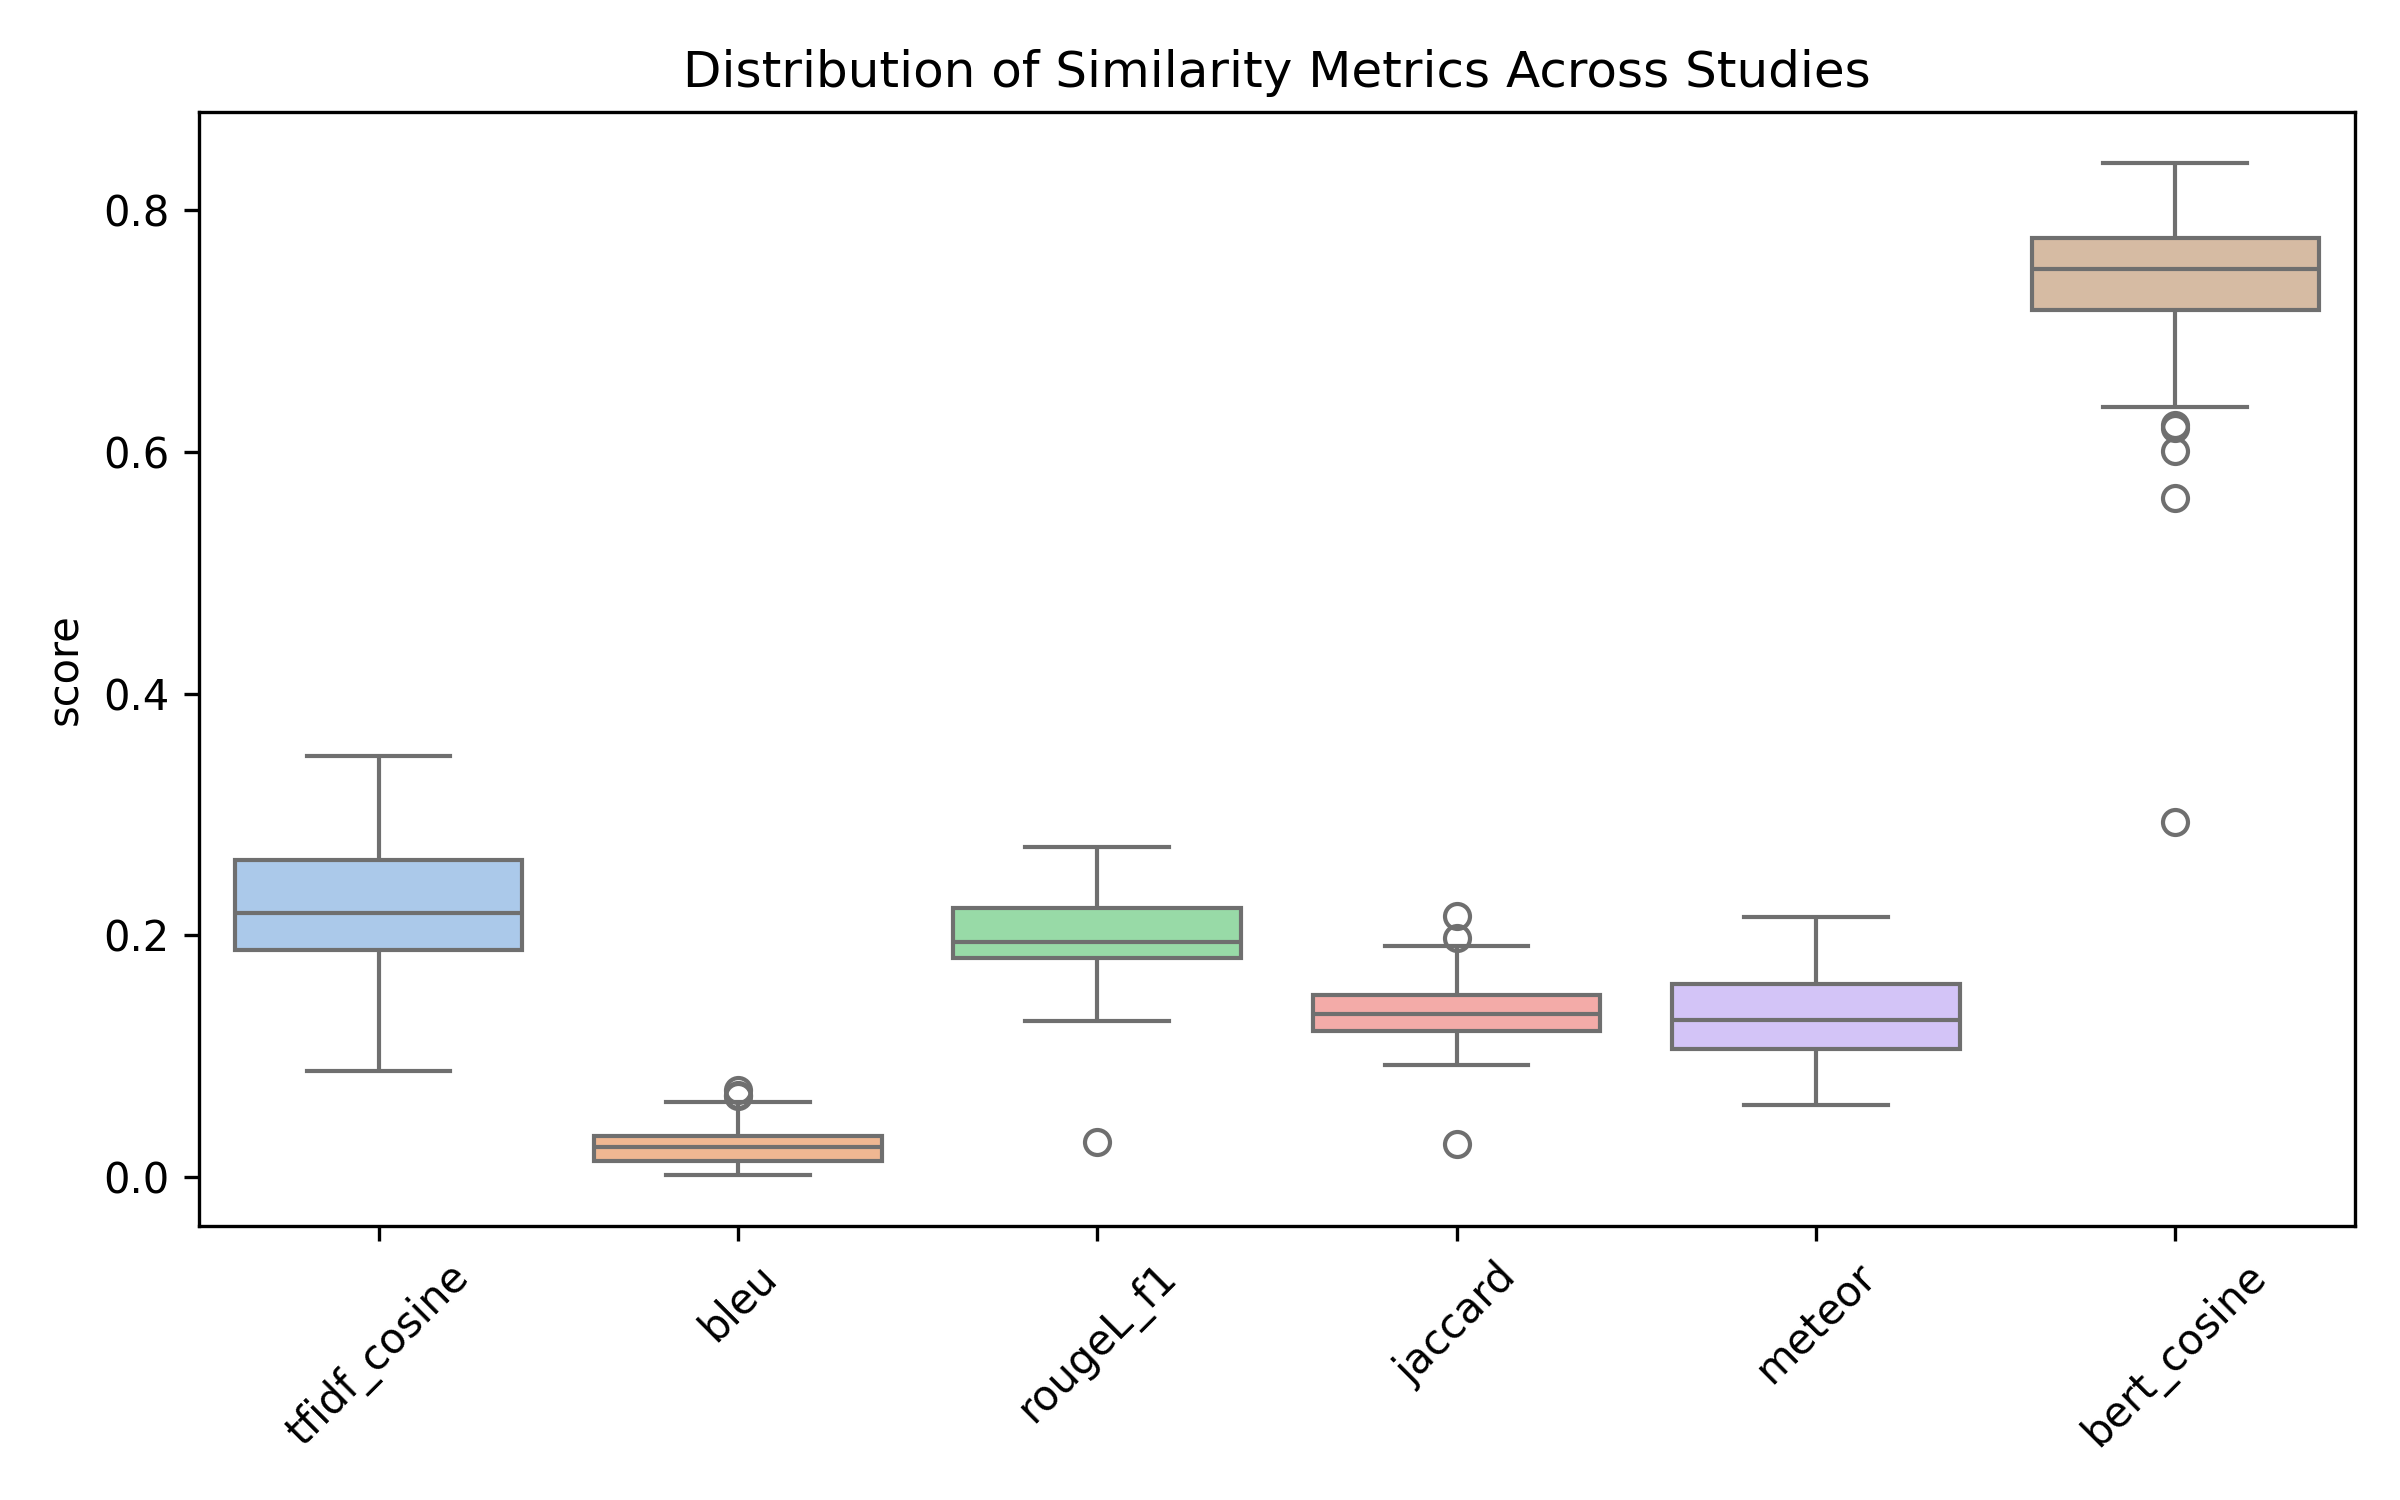
Figure 7. Boxplot of all evaluation metrics (BERT cosine, TF-IDF, ROUGE-L, BLEU, METEOR, Jaccard) comparing semantic and lexical similarity between MedGemma-generated and reference reports. The plot highlights that semantic similarity (≈ 75%) is consistently higher than all lexical metrics (≈ 10–28%), confirming that the model preserves meaning while paraphrasing rather than copying text.
The boxplot comparison clearly shows the gap between semantic and lexical metrics: semantic similarity (around 75%) is substantially higher than all lexical metrics.
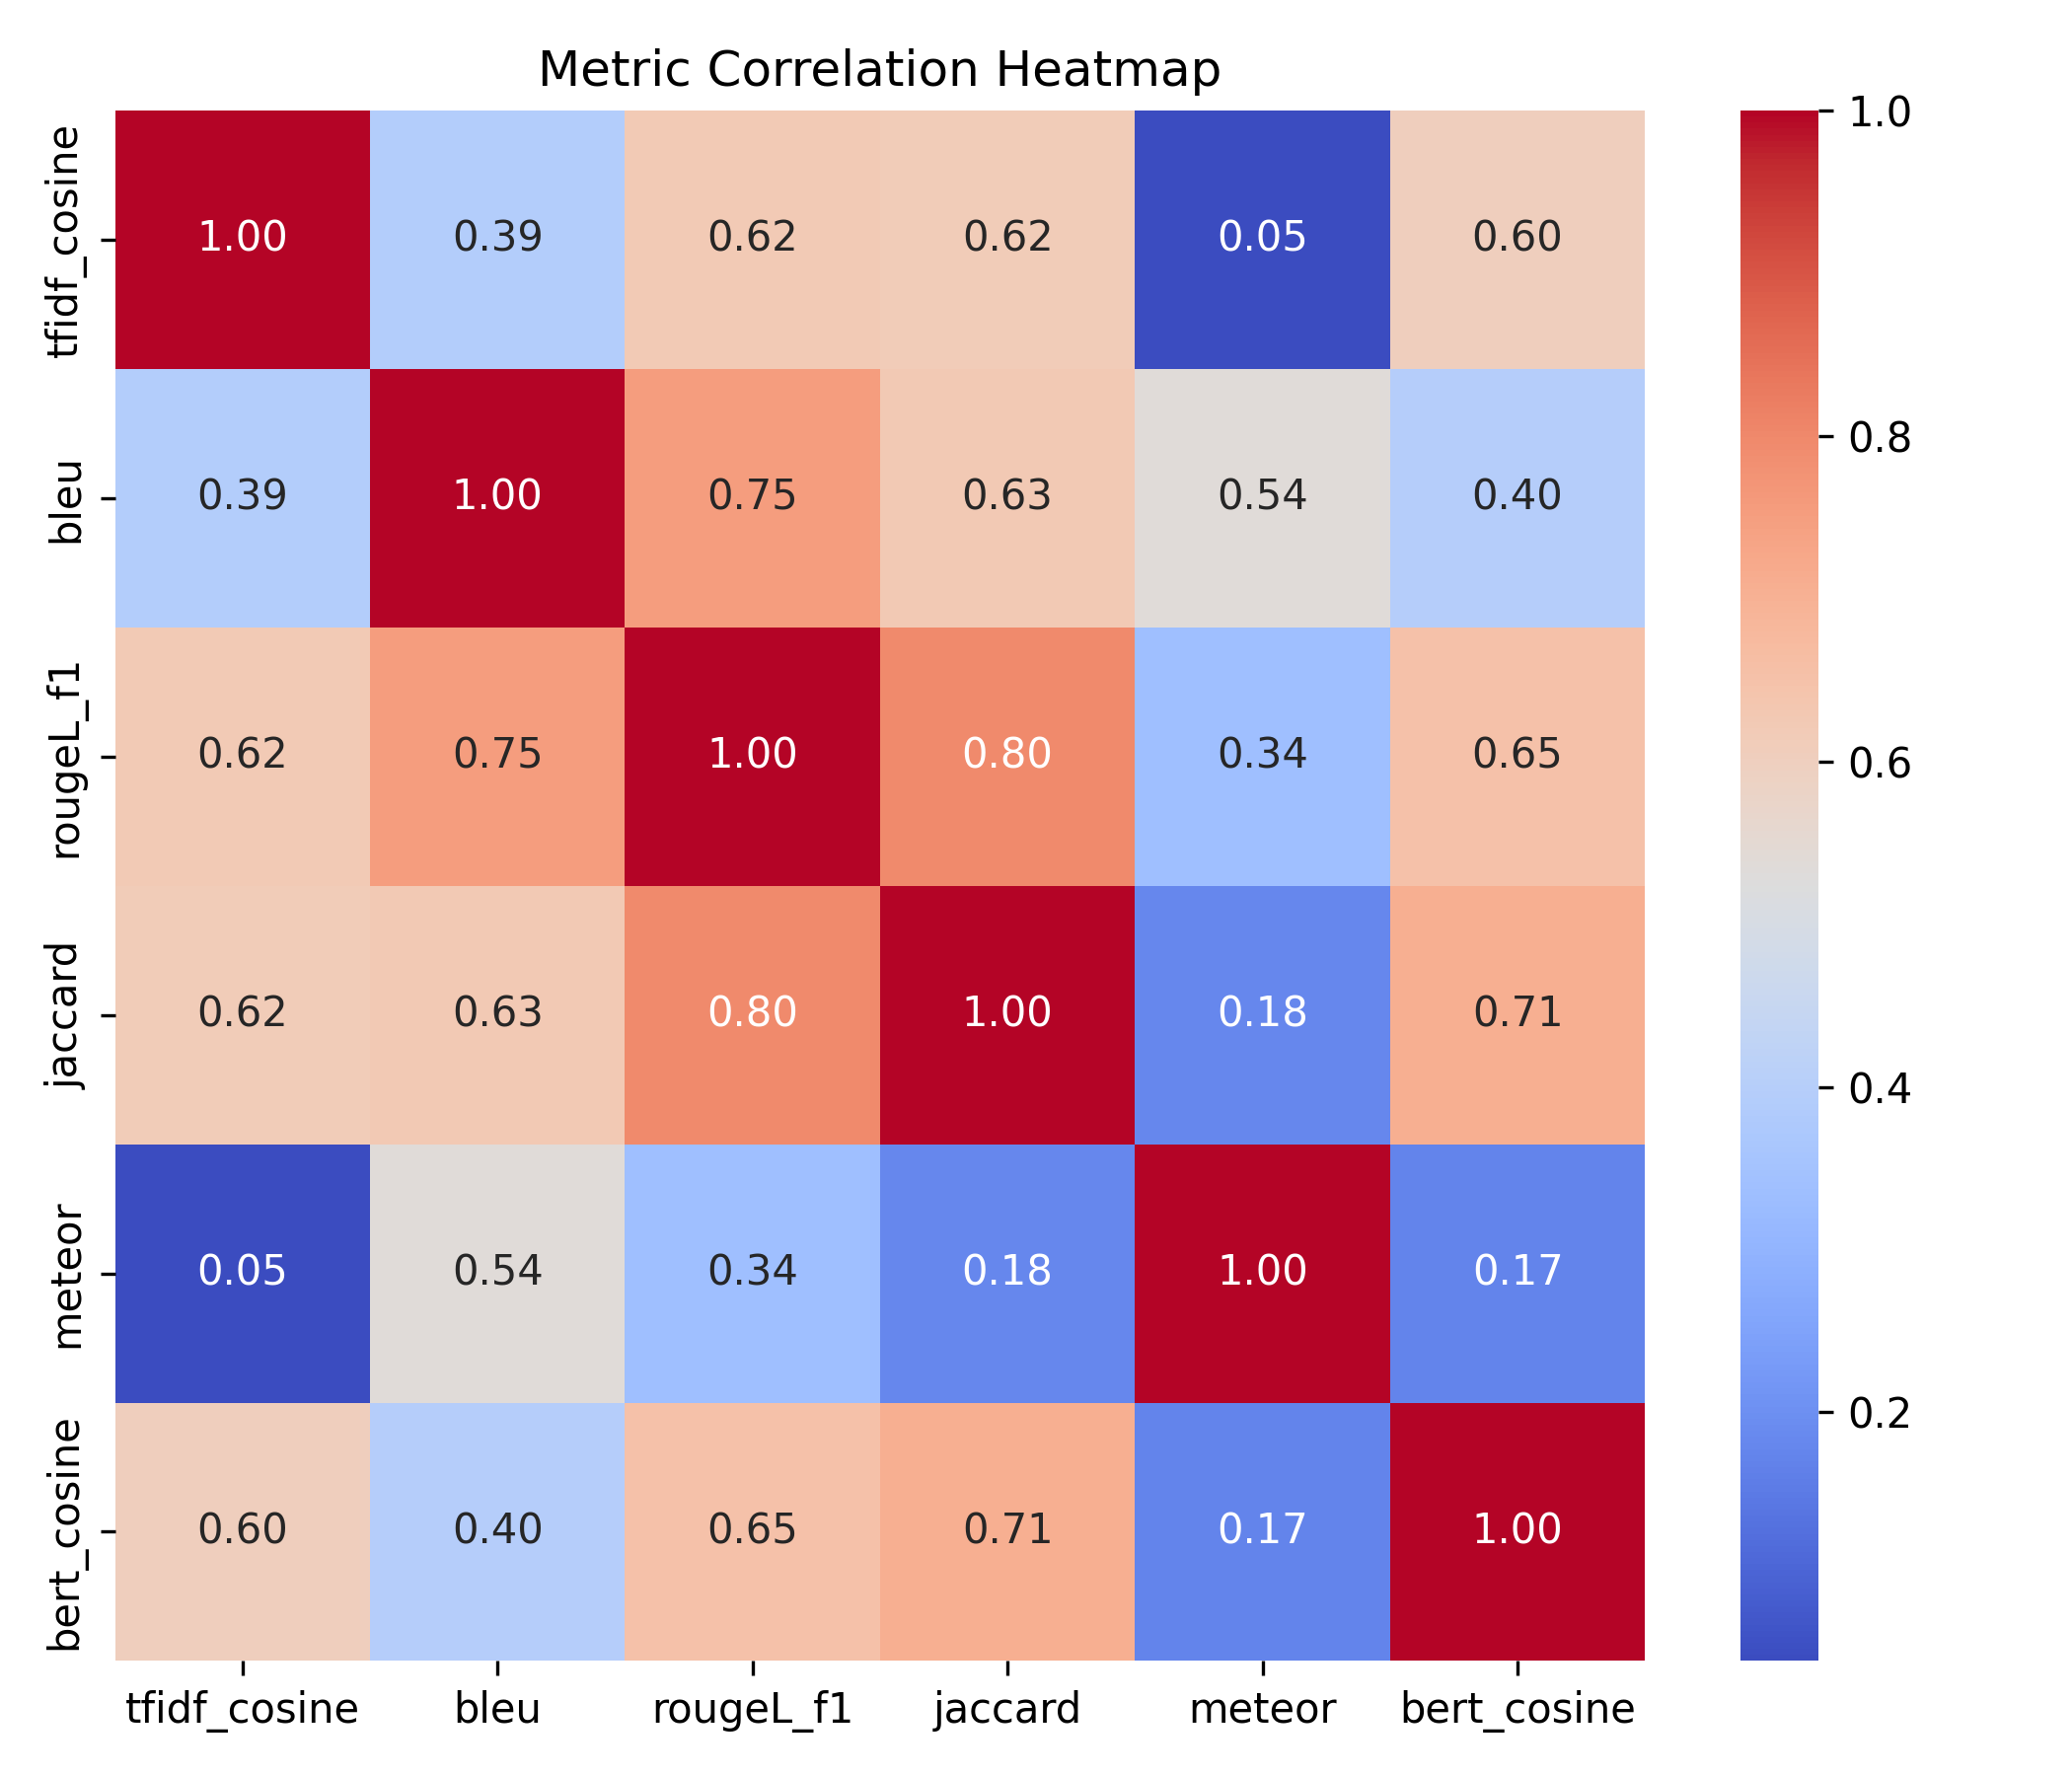
Figure 8. Correlation heatmap showing relationships among all metrics. ROUGE-L, BLEU, and Jaccard form a lexical cluster, while BERT cosine correlates moderately, highlighting its semantic focus. METEOR shows weaker connections, capturing both lexical and semantic aspects.
The correlation heatmap reinforces the strong correlations among ROUGE-L, BLEU, and Jaccard (lexical-focused metrics), while BERT cosine shows only moderate correlation due to its semantic focus. METEOR appears less connected, implying it captures a mix of wording and meaning.
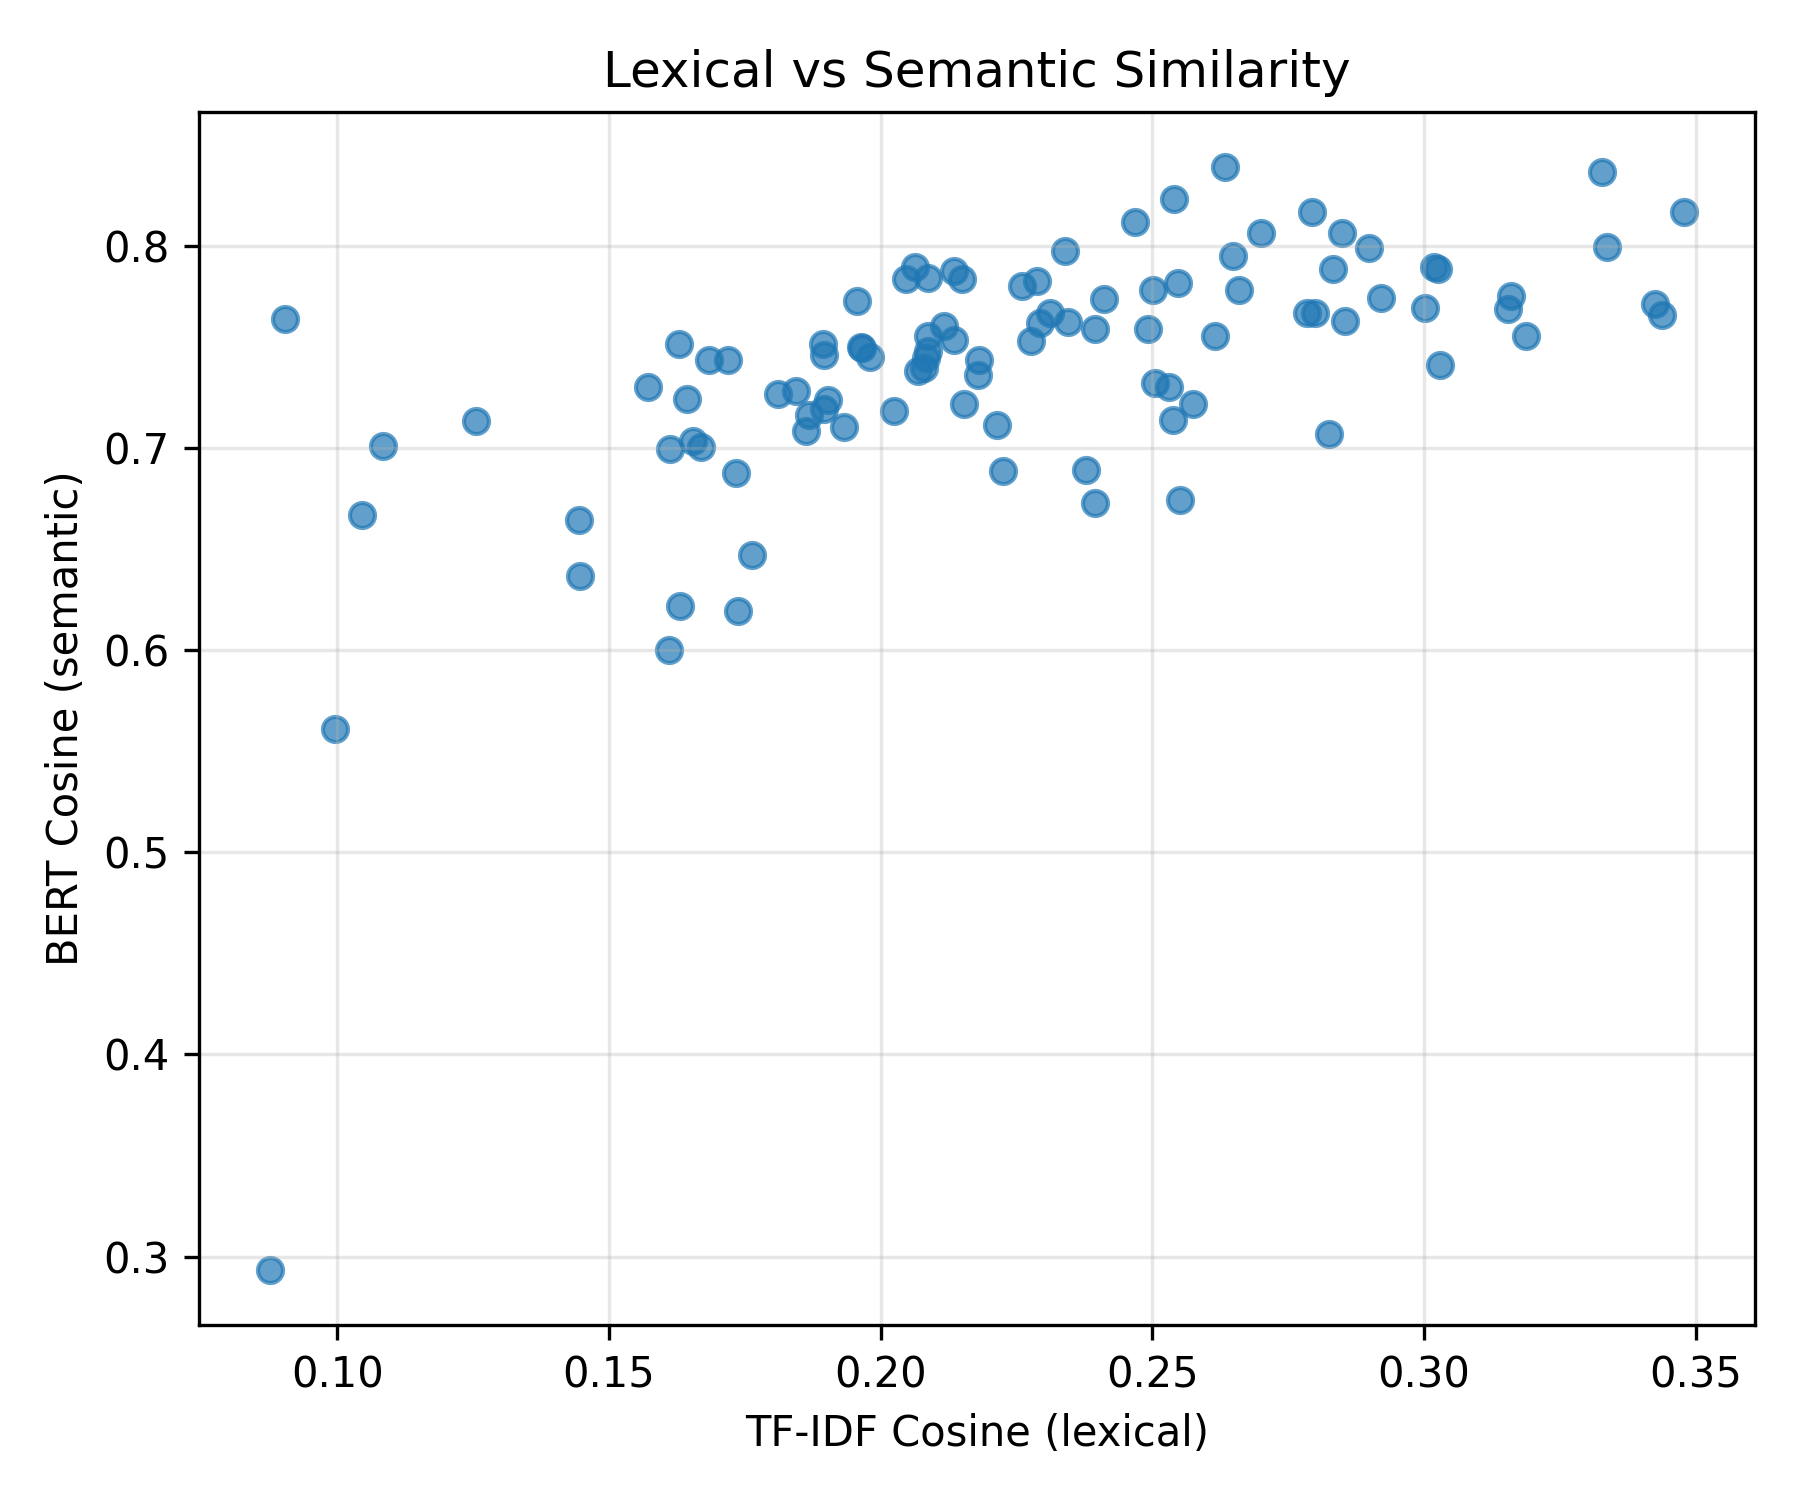
Figure 9. Scatter plot comparing TF-IDF cosine and BERT cosine similarity across all studies. The plot shows an overall positive trend—higher lexical similarity tends to align with higher semantic similarity—but with wide variation. Many points exhibit high semantic similarity (≥75%) despite low lexical overlap (≤20%), illustrating that MedGemma frequently paraphrases while preserving meaning.
The TF-IDF vs BERT scatter plot reaffirms this relationship: a positive overall trend exists, where higher lexical similarity corresponds to higher semantic similarity, but variation remains — some outputs have high semantic similarity but low lexical overlap due to paraphrasing.
Interpretation
The model performed well overall as the reports that were generated have a high semantic consistency of around 75%, so they matched the meaning of the true radiology reports, even though the wording differed. The model was correctly able to capture the main clinical ideas from the images. However, it performed more poorly on the metrics that look at the specific wording, like ROUGE-L, BLEU, and TF-IDF, because the model paraphrases and uses different words to convey what was showing in the images. These low lexical scores don’t indicate that the reports are wrong, but that it expressed the information in a different way. There are also a few outlier cases where the semantic scores are low which can mean that the model might not have understood the image or provided a report that is not as accurate, but overall the results indicate that the model is better at capturing the meaning of the report than matching the exact text.
Next Steps
In terms of next steps, our main goal is to tighten up our dataset as well as to build a more complete comparison across our three models (LLaVA-Med, MedGemma, and BioMedCLIP) to understand each model’s strengths and limitations. Currently we only have partial outputs from BioMedCLIP, so one of our first steps will be to complete extracting image embeddings for every study and organize them into a standardized, consistent format. Once those embeddings are done, we can run clustering analysis, visualizations (UMAP), and retrieval experiments. This will allow us to evaluate if the embeddings contain the key medical information needed for urology scans.
A major next step will be to fine-tune MedGemma. Currently we used MedGemma without any fine-tuning so it has not been adapted to our specific domain and task. For fine-tuning, we plan to:
- Tokenize a larger set of image–report examples, expanding beyond the current 99 studies that we have
- Train MedGemma on specifically urological ultrasound reports so that it learns the wording and style used in this domain
- Use structured prompts and consistent formatting so that we have consistent generation when we are training
- Experiment with training only specific parts of the model, like the text-generation layers, so that fine-tuning is more efficient
- For example, for MedGemma we can fine-tune just the decoder head (the part that has the responsibility of turning image features into natural-language text); this would allow the model to keep its general medical image understanding while learning specific structures and phrases that are used in urology reports
Fine-tuning on the urological data will help all three models be better learners when coming across the same patterns in images. With this, we hope to see semantic similarity increase and it will also help us better understand how much of the model’s performance is simply due to the models not being adapted to our data yet.
We also intend to create a cleaner set of outputs using MedGemma so that we can evaluate these outputs with the same metrics (TF-IDF, BLEU, ROUGE, etc.) which we used on the real reports. Our goal is to finish our project with a clear evaluation of what each model does well and where it fails, as well as whether fine-tuning or multimodal methods actually help to improve report quality.
References
[1] D. Golden and R. Pilgrim, “MedGemma: Our most capable open models for health AI development,” Google Research, Jul. 09, 2025. https://research.google/blog/medgemma-our-most-capable-open-models-for-health-ai-development/ (accessed Oct. 02, 2025).
[2] C. Li et al., “LLaVA-Med: Training a Large Language-and-Vision Assistant for Biomedicine in One Day,” Jun. 2023. doi: https://doi.org/10.48550/arXiv.2306.00890.
[3] S. Zhang et al., “BiomedCLIP: a multimodal biomedical foundation model pretrained from fifteen million scientific image-text pairs,” Jan. 2025. doi: https://doi.org/10.48550/arXiv.2303.00915.
[4] K. Huang, J. Altosaar, and R. Ranganath, “ClinicalBERT: Modeling Clinical Notes and Predicting Hospital Readmission,” Nov. 2020. doi: https://doi.org/10.48550/arxiv.1904.05342.
[5] E. Hsu, I. Malagaris, Y.-F. Kuo, R. Sultana, and K. Roberts, “Deep learning-based NLP data pipeline for EHR-scanned document information extraction,” JAMIA Open, vol. 5, no. 2, Jun. 2022, doi: https://doi.org/10.1093/jamiaopen/ooac045.
[6] J. K. James et al., “Experience With an Optical Character Recognition Search Application for Review of Outside Medical Records,” Mayo Clinic Proceedings: Digital Health, vol. 2, no. 4, pp. 511–514, Aug. 2024, doi: https://doi.org/10.1016/j.mcpdig.2024.08.001.
[7] G. Preda, “From X-rays to Insights: Exploring MedGemma 4B’s Medical Multimodality,” Medium.com, May 25, 2025. https://medium.com/@gabi.preda/from-x-rays-to-insights-exploring-medgemma-4bs-medical-multimodality-ef620a4d8264 (accessed Oct. 03, 2025).
[8] L. Yang et al., “Advancing Multimodal Medical Capabilities of Gemini,” May 2024. doi: https://doi.org/10.48550/arXiv.2405.03162.
[9] K. Saab et al., “Capabilities of Gemini Models in Medicine,” arXiv.org, May 01, 2024. https://arxiv.org/abs/2404.18416 (accessed Oct. 02, 2025).
Gantt Chart
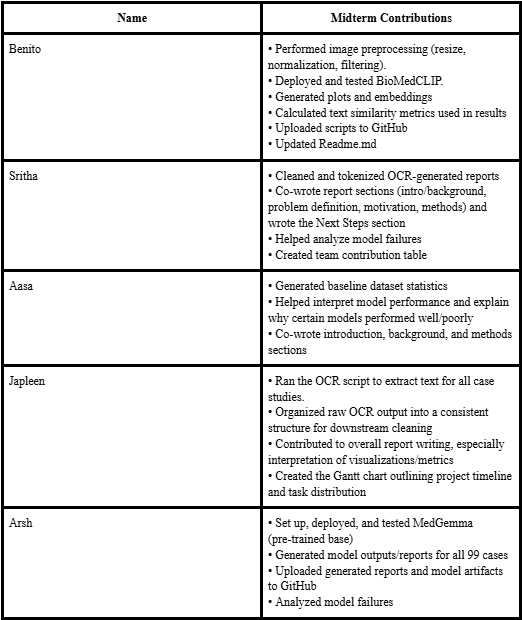
Contribution Table